

Tracking the Lead Sources on monday.com CRM
You can build a dashboard on monday.com with the data of the business leads you have. It will be a one-stop shop for all insights about your sales. Maybe Facebook ads work better than Instagram. Or your homepage downloads more than other pages. Armed with data, you can boost your best performing tactics.
Set up the Dashboard
To track your lead sources, start by adding a status column labeled as “Source” to your Leads Board. This allows you to log where every contact originally heard about your business. Your options might include labels like “Facebook”, “Paid Ads”, “Referral”, or “Previous Client”.
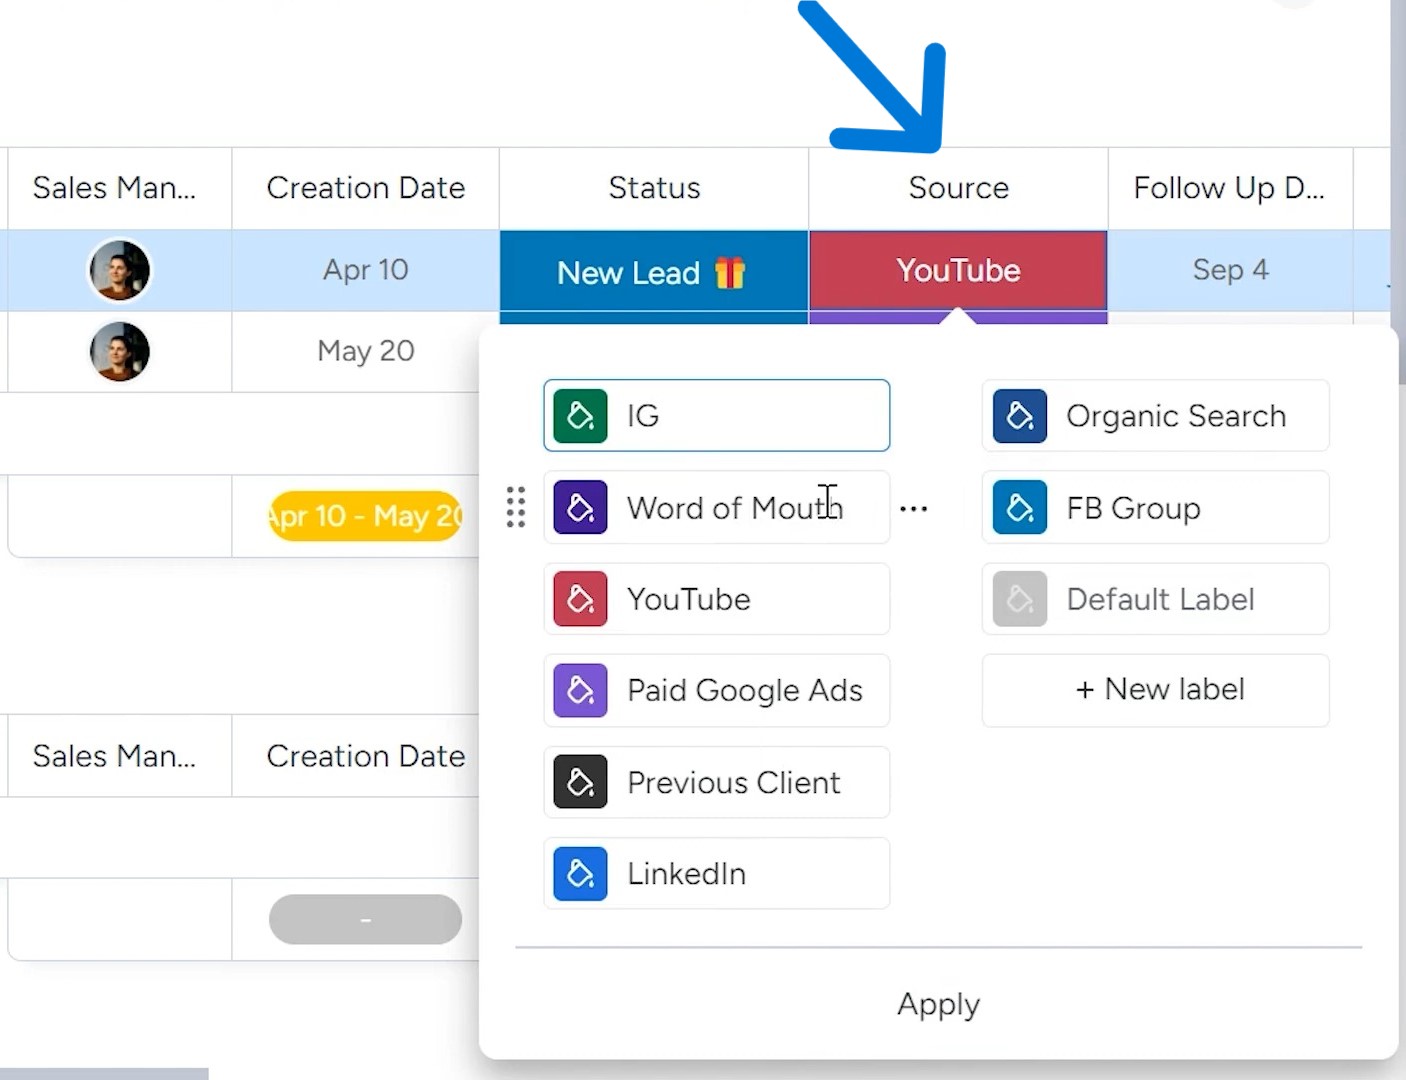
You’ll want to note the source for all leads, whether they become customers or not. Just click “Edit” and type in your various marketing channels so they’re easy to pick from.
As leads come in from any channel like emails, ads or word of mouth, spend a quick second choosing the right source label.
You can manually enter the source for each new lead. For example, if a lead came from your website, enter “Website” as the source. If it was from a Facebook ad, enter “Facebook”. You don’t need to type long URLs every time.
Even better, you may be able to automate lead source tracking. For example, if you use a tool to sync website leads into monday.com, you could set the source to automatically fill in as “Website”. The same goes if you’re collecting leads from MailChimp through SuperForm or monday.com Forms. This saves manual work.
Create a Data Chart
Once you have entered all your lead information into the leads board on monday.com, you need a way to see where your best leads are coming from.
To do this, add a chart widget to your sales dashboard. Click “add widget” and choose the pie chart option. Then select the “Source” field from your leads board as the label. This will show you the percentage of leads generated from each source like Google ads, Facebook, referrals, and more.
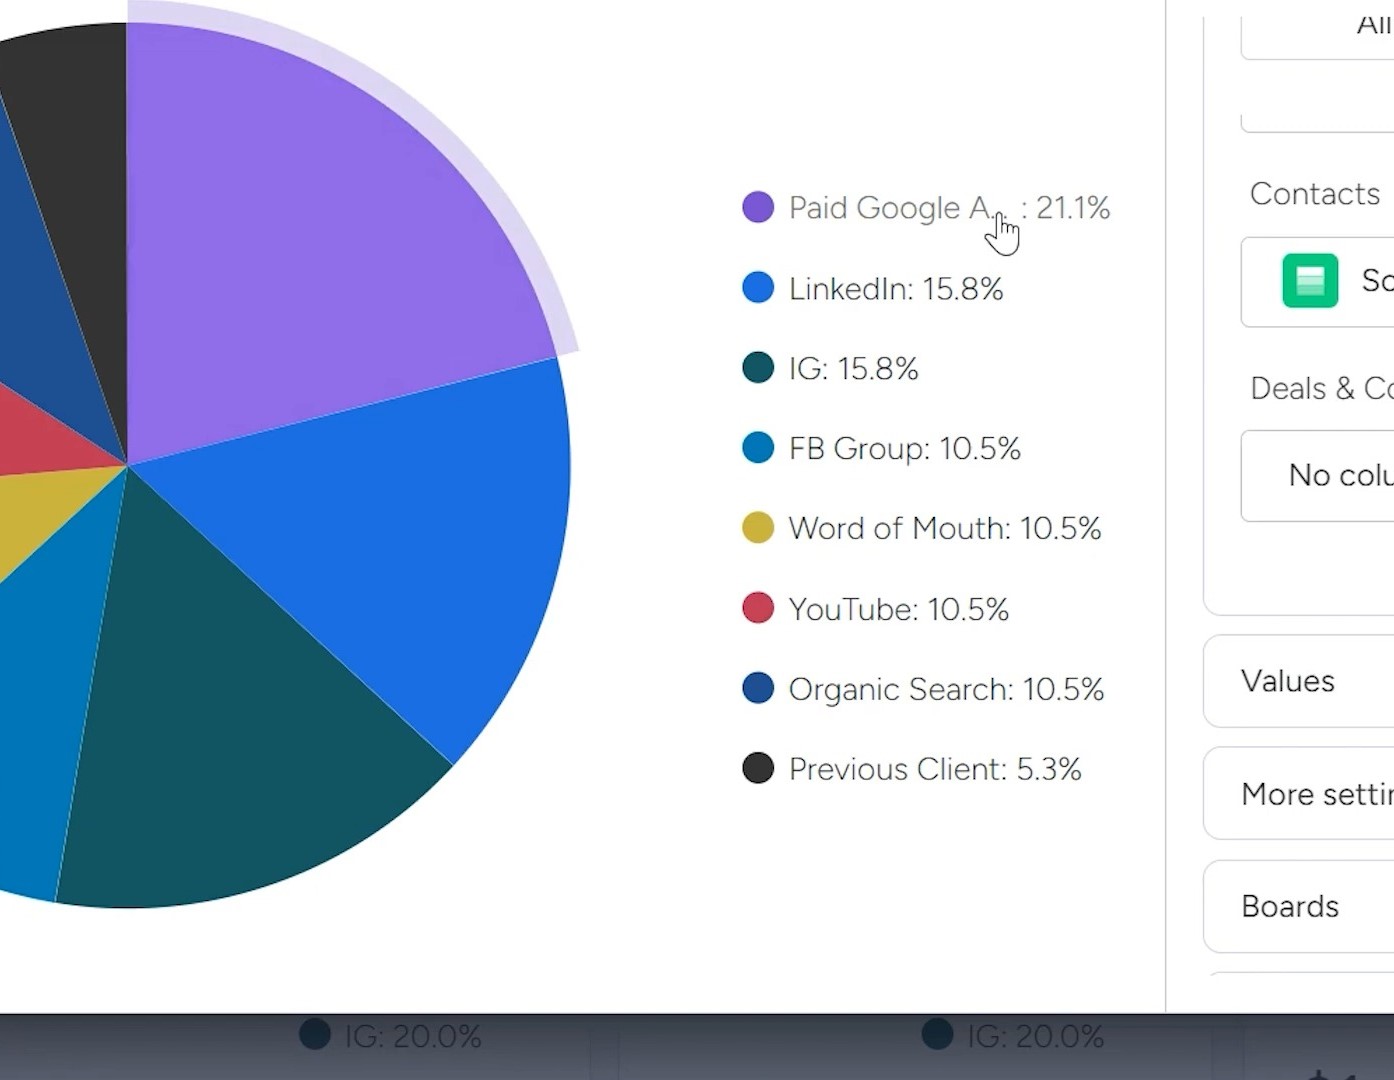
The pie chart makes it easy to see at a glance which sources are bringing in the most leads. For example, you find that paid Google ads are responsible for over 21% of new leads. This tells you that Google ads are worth continuing to invest in.
You can also see if sources like blogs, videos, or social media are driving traffic and leads. Knowing the source of your leads helps you recognize what marketing strategies to double down on and what may not be worth the resources.
By using the same data, you can also create different dashboards. For example, you can select a bar chart widget and show your leads there by number of sources.
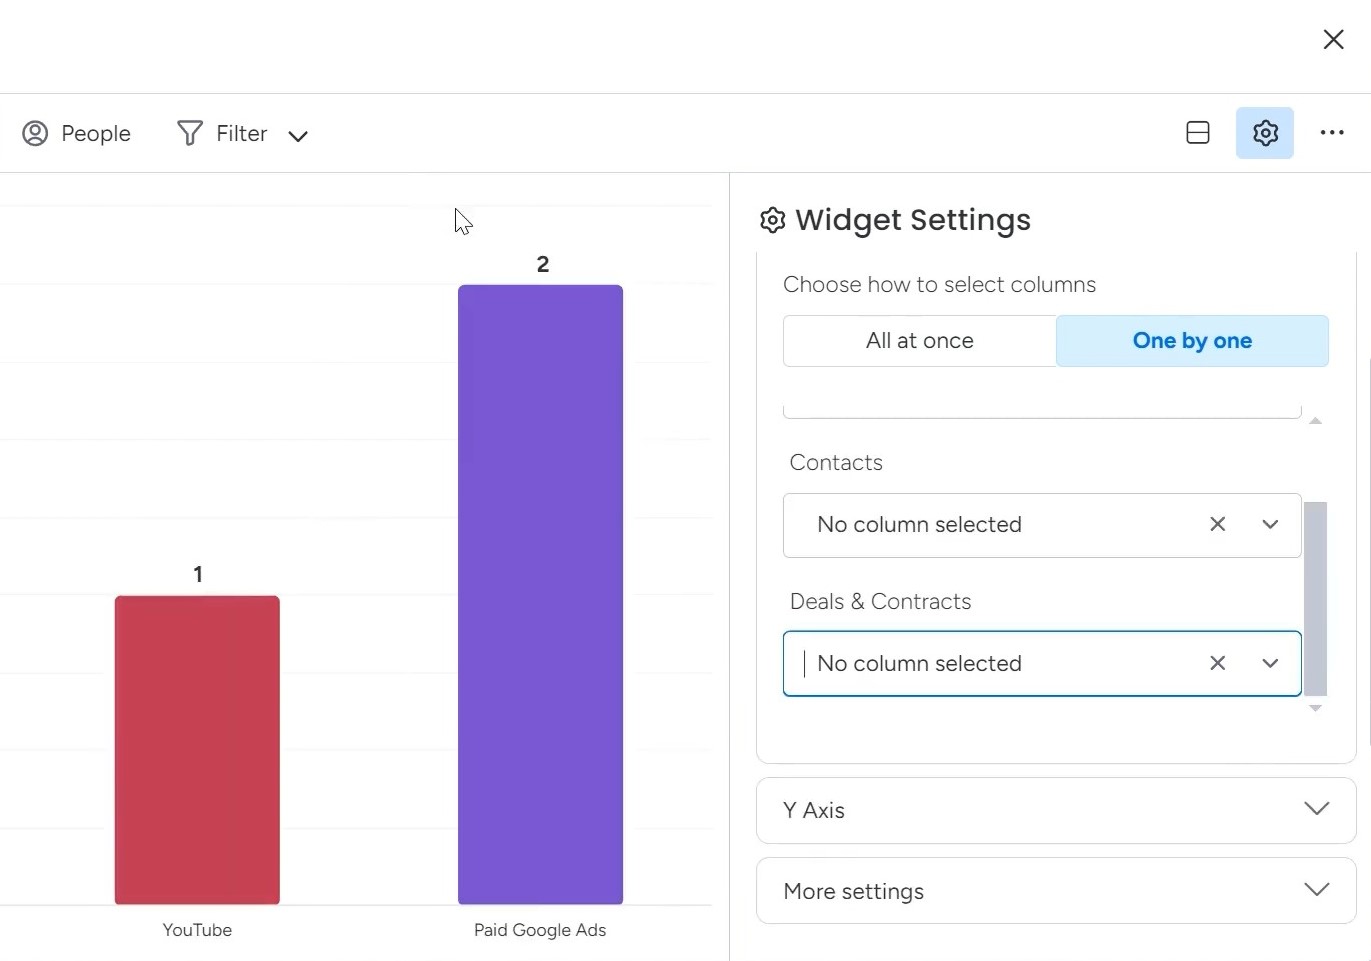
So, you can see in the image above that I have two leads from Google paid ads and one from YouTube.
It’s a simple way to spot what’s driving new business so you know where to focus your marketing spending. Seeing the source data right in monday.com makes it effortless to track leads and optimize how you find new customers.
Learn how to implement monday.com and improve your workflows through Simpleday’s guided setup services. Our experts help you analyze your processes, customize boards and Dashboards, integrate apps, and kickstart projects. Book a FREE consultation.