Keeping tabs on your finances doesn’t have to be a major headache! With the right tools, you can easily stay on top of your expenses, revenue, and overall profit. monday.com offers a super helpful workflow that takes the stress out of financial management.
I’ll walk you through how to use monday.com to master your finances. You’ll learn how to set up customized boards to track billings and expenses. I’ll connect data across boards to roll up into key metrics like revenue and profit. Then, we’ll turn those metrics into insightful dashboards so you can visualize all the numbers.
Setting up the Boards
Your first task is to set up some boards. In this example, I’ve set up three interconnected boards: Billing, Expenses, and Stats.
1. Billings Board
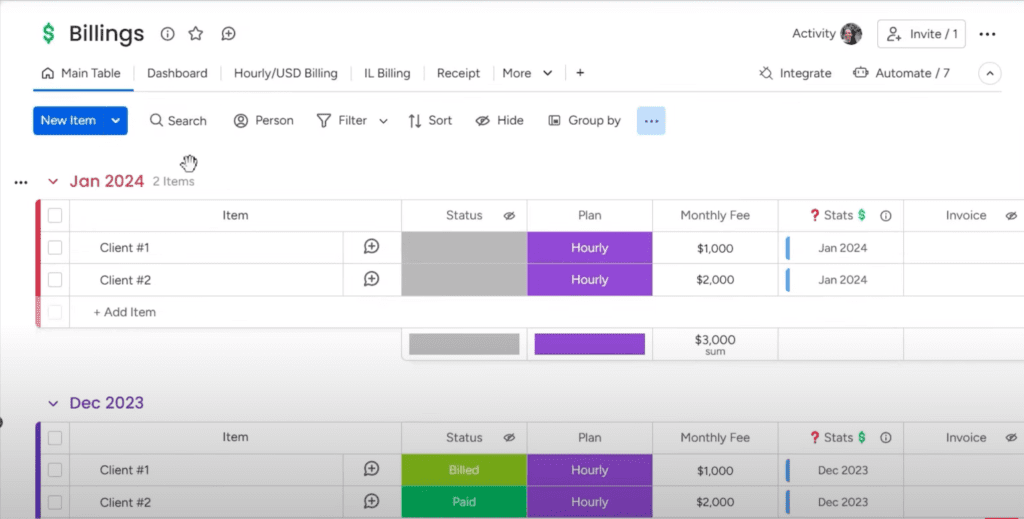
This is where you’ll track all your client invoices and billings month-to-month. For example, you could have a group for each month of the year.
Then, inside each group, you’ll add items for each client you need to bill that month, along with their billing details like the plan, fees, etc.
2. Expenses Board
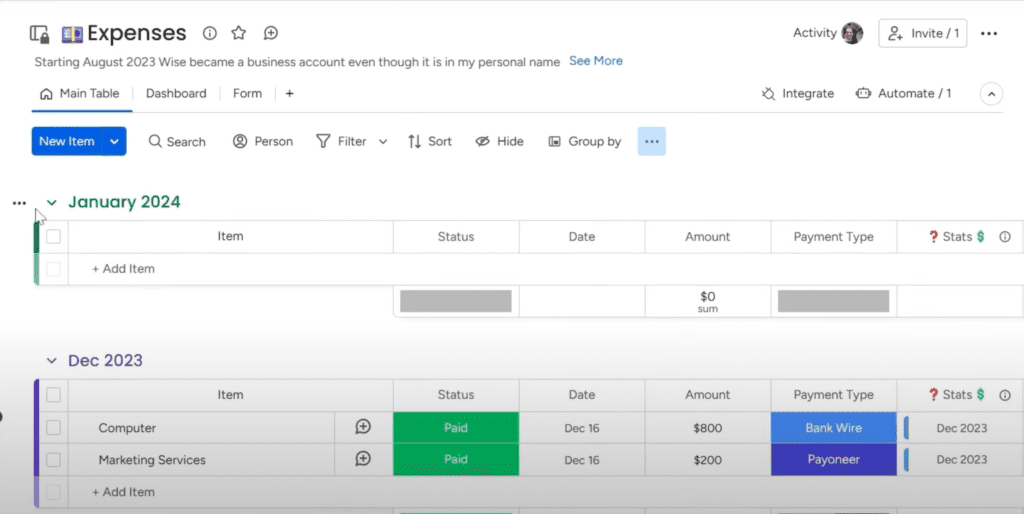
You guessed it, this tracks all your business and personal spending over time.
Set it up the same way as the Billings board, with groups for each month. Add items for each expense like office supplies, software, travel costs, and so on.
You can check the entire process in this video. I’ve broken down every step in an easily understandable way.
3. Stats Board
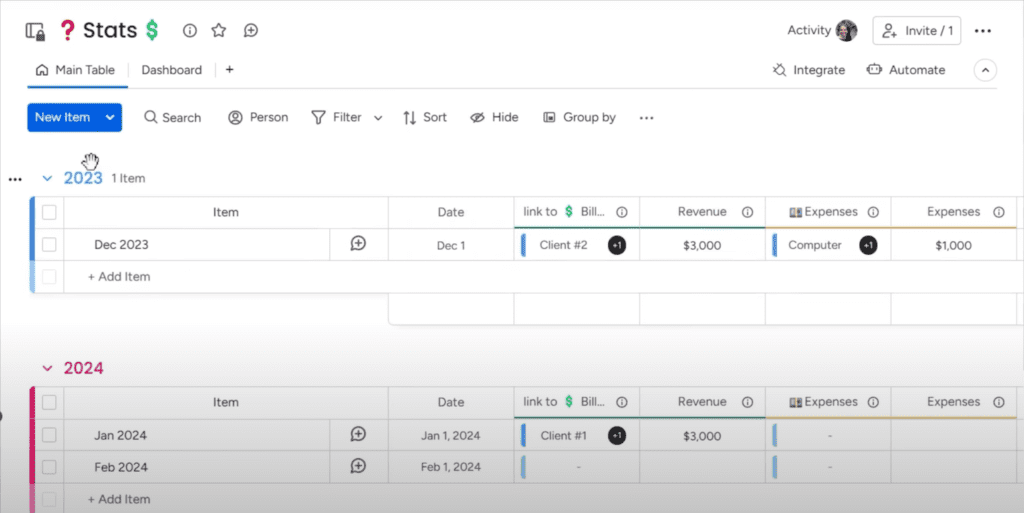
This one aggregates and crunches the numbers from your other two boards. Here, you’ll see all your financial data rolled up into totals, including revenue, expenses, profit/loss, so you can easily view your big picture finances.
With these three boards connected, you’ll have a complete system to manage billings, spending, and financial metrics in one place. As you add more client invoices and expenses each month, your Stats board will auto-update.
Connecting the Boards to Track Finances
Your next task is to link all these boards, so data gets updated on all of them when changes are made.
Let’s see how it works:
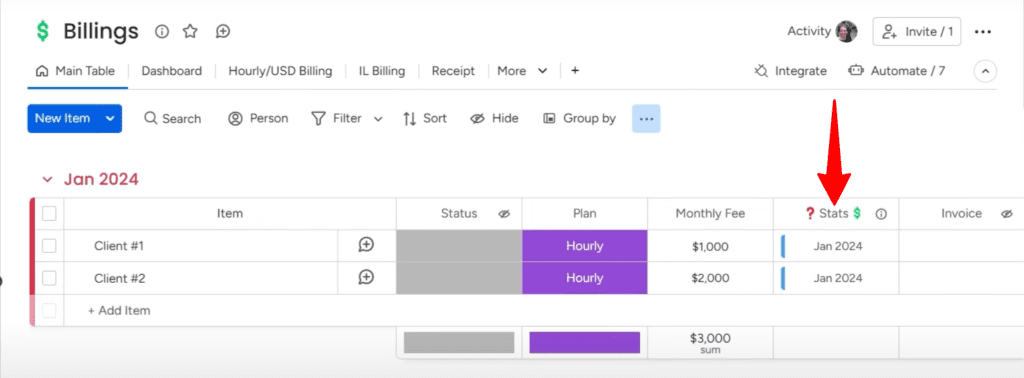
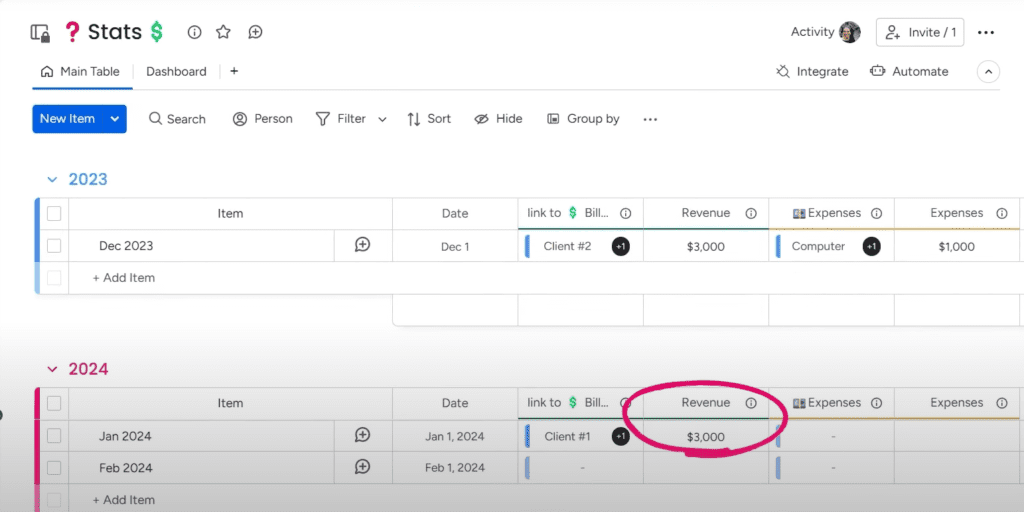
On the Billings board, you’ll connect each client invoice item to the matching month in the Stats board. For example, an invoice to Client #1 for $1,000 in January would link to the January group on Stats.
In the image above, you can see that the total sum of revenue from two clients is $3,000. Since the boards are connected, you will find this total revenue on the Stats board too.
How to Set the Linked Boards
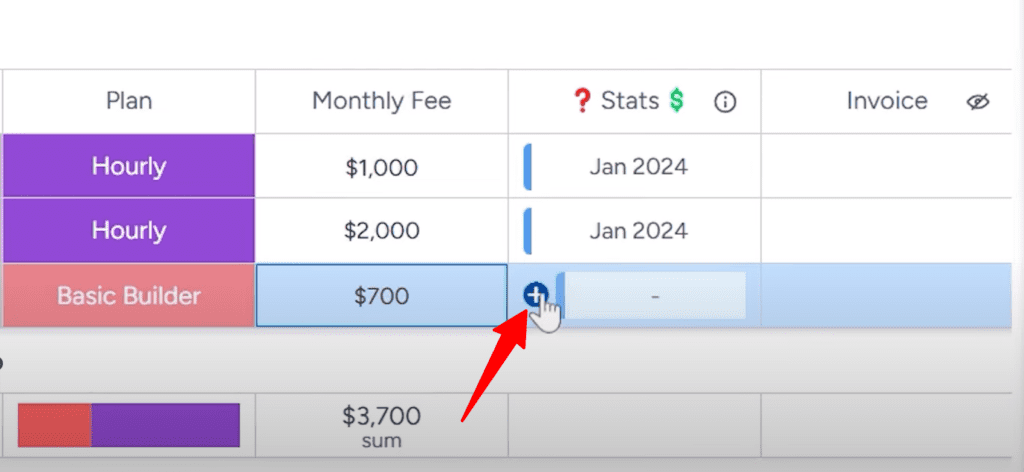
You can manually link items by clicking the “+” button in the box and selecting the target item on Stats.
Let’s say you land a new client and need to add them to your billing system. Just create a new item for them in the Billing board with their plan details and fees. For example, I’ll add “Client #3” at $700 monthly. Now, my total revenue for January has increased to $3,700.
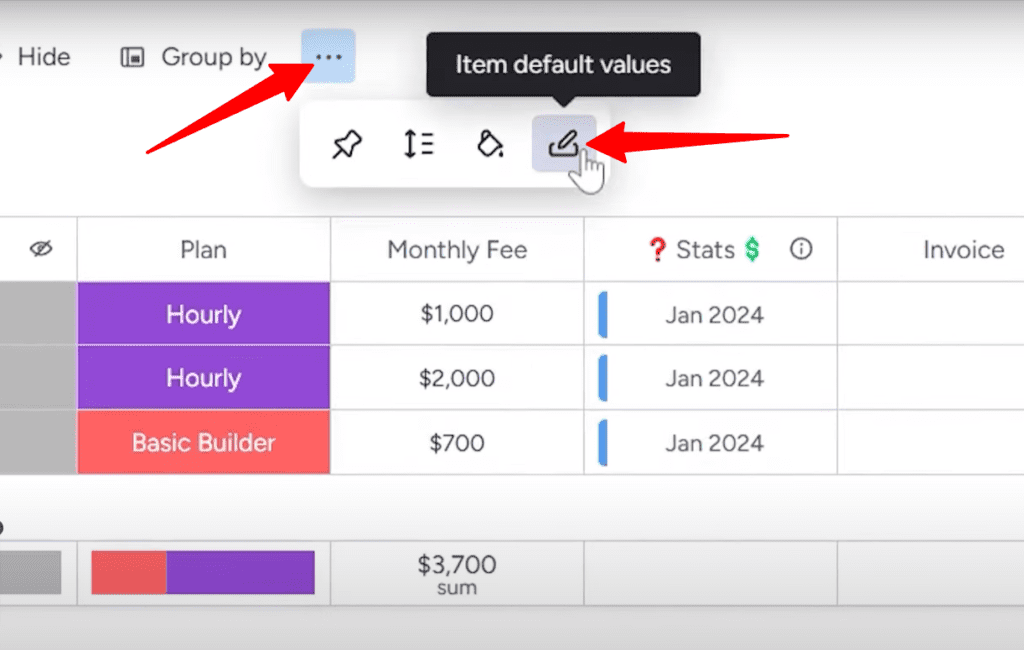
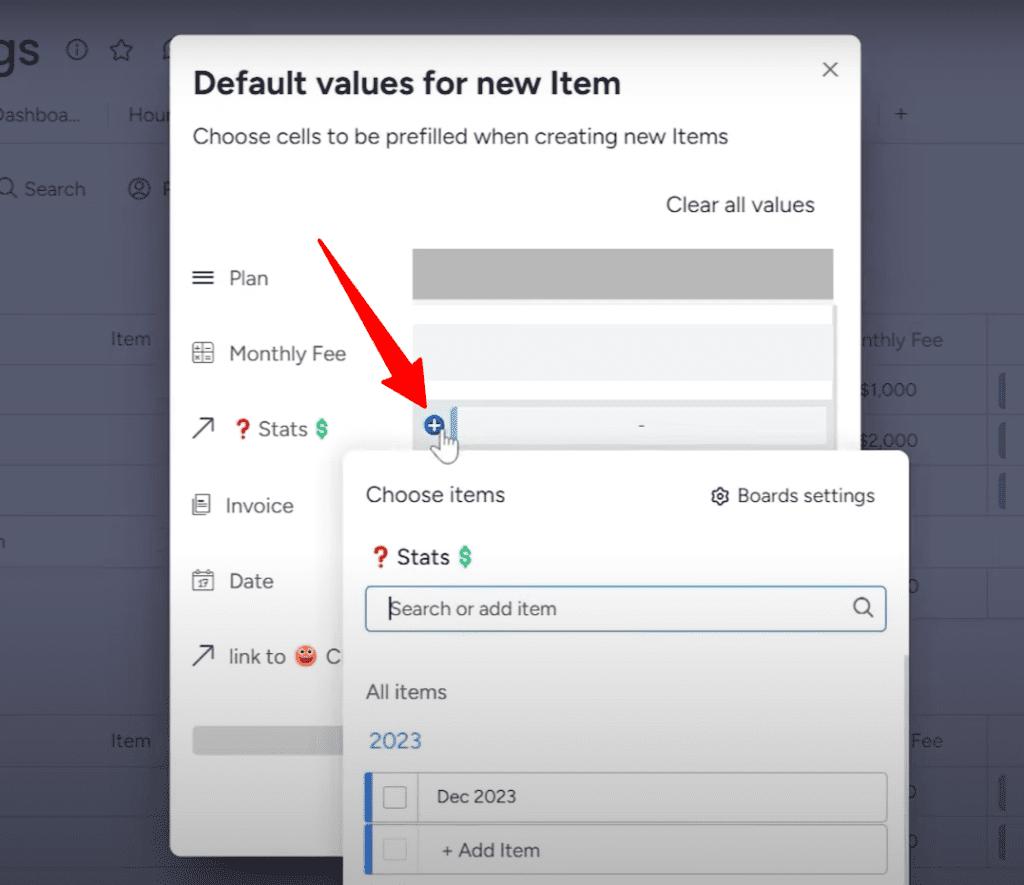
To keep things simple, you can set up “default values” to automatically link new clients to the right month in the Stats board. When you do so, each client you add will connect to January 2024 automatically.
Do the same thing on the Expenses board. Set up linked items to connect each expense to the corresponding month item on Stats.
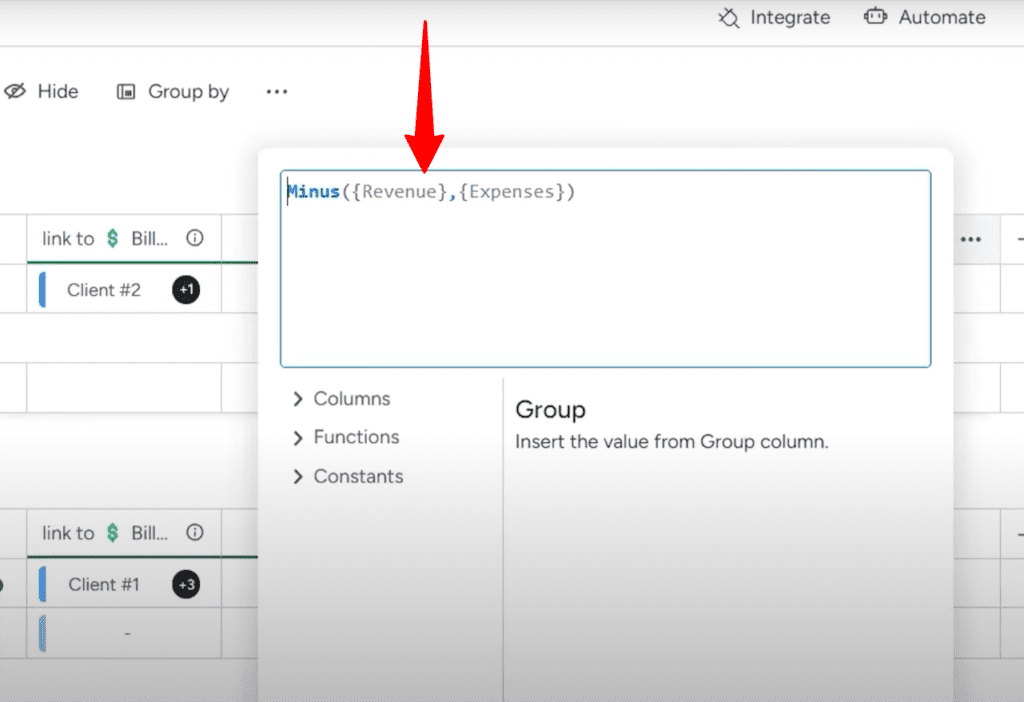
Now comes the payoff. With the boards connected, your Stats board will automatically sum up the revenue and deduct the expenses to calculate the profit.
For example, if you have $5,000 in invoice revenue and $2,000 in expenses in June, the June item on Stats will show $5,000 revenue, $2,000 expenses, and $3,000 in profit.
You have to set the Profit column as Formula, so it can calculate everything and show you the correct numbers.
Viewing Insights in Dashboards
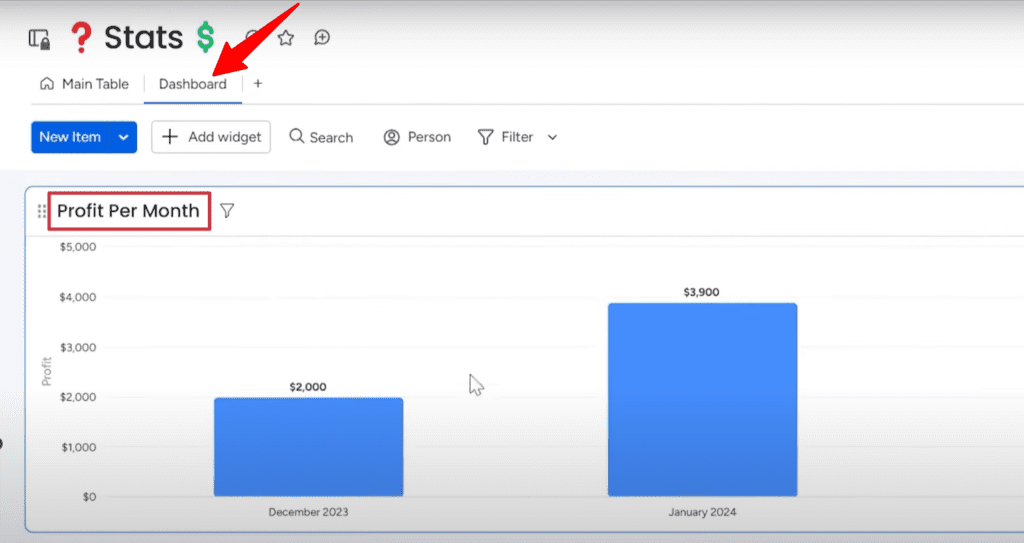
Now comes the fun part, turning all your financial data into intuitive dashboards. This lets you visualize your finances to gain insights into the health of your business.
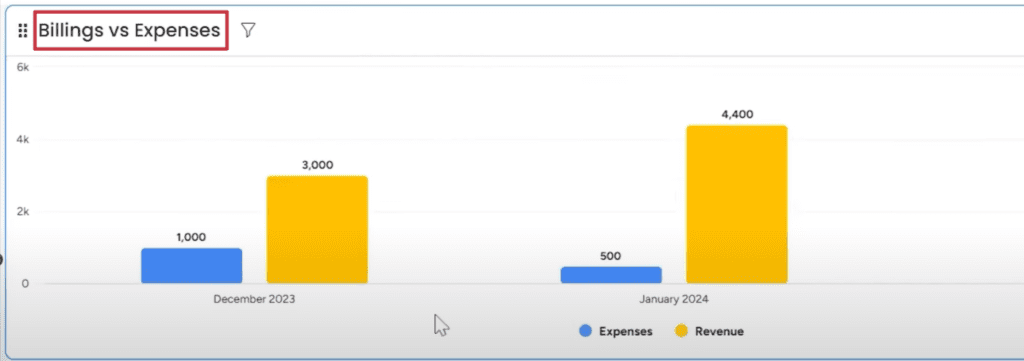
You can view metrics like monthly profit or compare billings vs expenses over time. For example, the dashboard shows I billed $11,000 in December but only profited $3,000 due to high expenses.
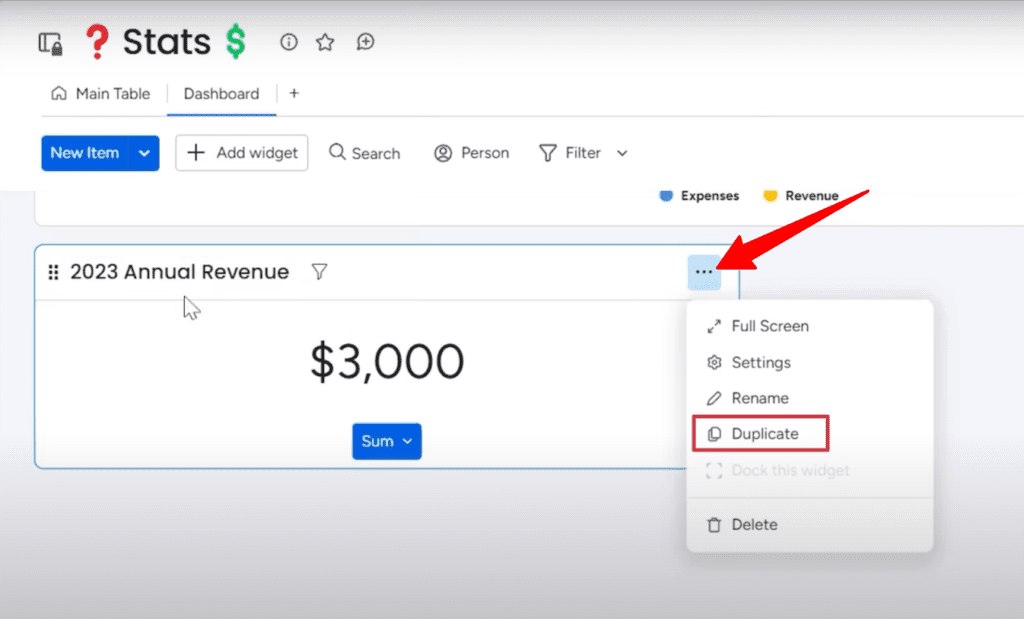
With a few clicks, I can make charts for any time period or metric I want. I created an annual revenue dashboard for 2023. When I’m ready to look at 2024, I can simply duplicate that dashboard and update the settings to pull from my 2024 board instead.
monday.com’s flexible dashboards allow me to visualize my finances from any angle. I can spot trends over time, compare metrics, and gain insights into what’s driving my profit and revenue.
With a few clicks, you can:
Track profit month-over-month or year-over-year
Spot seasonal dips and spikes in revenue
See which clients bring in the most money
Identify expense categories to cut back on
Compare budgets to actual spending, and more!
Start managing your finances simply with the basics, then keep expanding as your business takes off! Learn all monday.com tricks at Simpleday. We help you take the full advantage of this platform.