
If you want to track the performance of your business, you need to measure the right metrics. And Key Performance Indicators (KPIs) are measurable values that help you understand how well your business is doing.
With monday.com, you can make a KPI dashboard to keep an eye on vital stats. Whether it’s website visitors or revenue, you can display the numbers that matter the most in your monday.com dashboard.
So, let’s figure out how to make a simple KPI dashboard in monday.com
What Is a Board in monday.com?
Think of a board as a spreadsheet (with superpowers), and you can see rows and columns showing different information. In the example below, there are groups for each year and rows for each month. You can divide this information in other ways, such as by quarter, weeks or days.
The columns contain numbers, like website visitors, revenue, orders, eBooks downloaded, form submissions, and more.
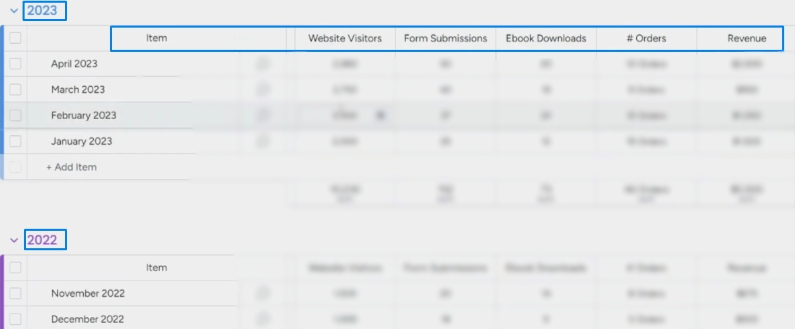
You can also add a column with formulas to calculate things. For example, revenue minus refunds for sales.
Later, you can add data to the columns manually or use integrations to pull in info automatically from other tools such as Google Analytics.
Steps to Build a KPI Dashboard in monday.com
You need to either create a dashboard view from your KPI board, or create a dashboard and pull information from one or a few of your boards.
You’ll get a handful of widgets to add to your dashboard and these widgets can help you easily track your KPI’s, depending on what you want to track and how you want to see the information.
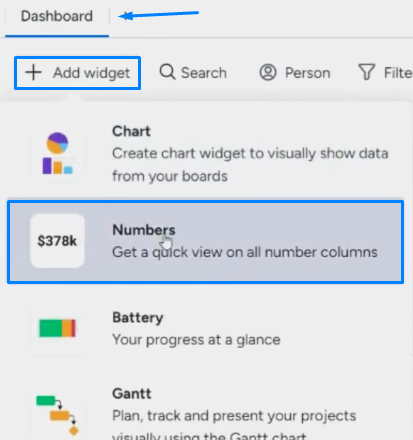
Numbers Widget
To make a dashboard, you can add widgets like the numbers widget to compare things like revenue, orders, visitors, and more.
If you want to compare two things, add two numbers widgets.
After adding the widgets, here’s what to do:
- Click the three dots on the right side. This takes you to the widget settings.
- Select two different years in each widget to compare.
- Make sure to use the correct column to pull the data from.
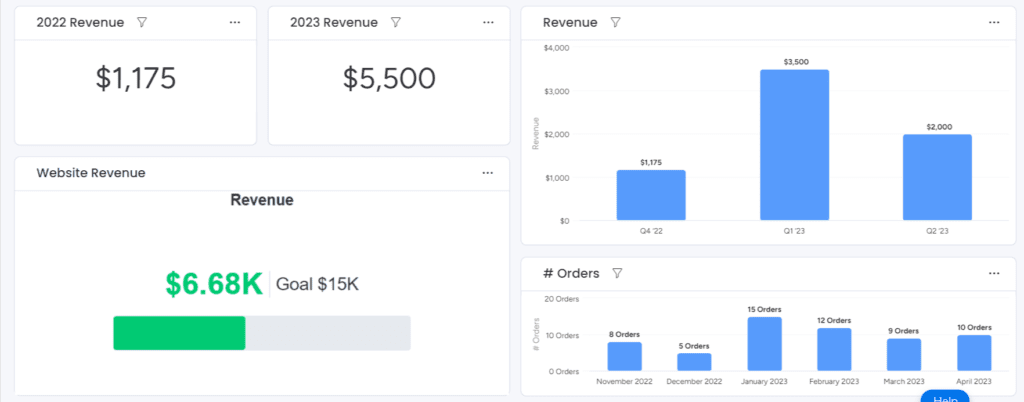
For example, I added two numbers widgets to compare 2022 revenue with 2023 revenue.
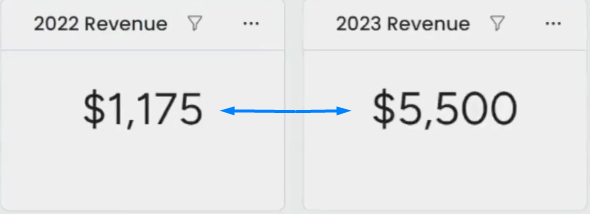
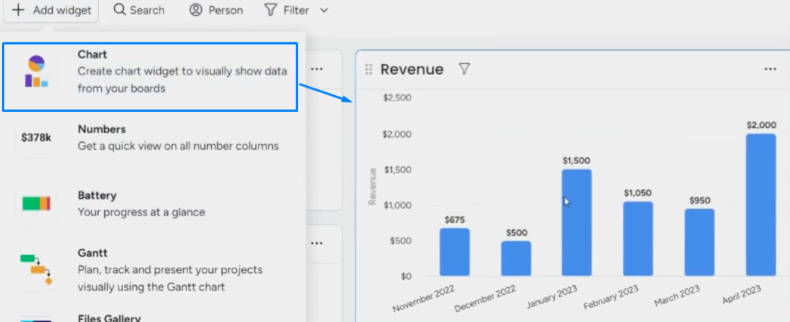
Chart Widget
You can track things like orders, visitors, downloads and revenue by adding a chart widget.
Follow these steps to create the widget:
- Click on add widget and choose the chart widget
- Click the three dots on the right side. This takes you to the widget settings.
- Choose the settings tab.
- Set it up by selecting columns of months, quarters, weeks or days.
Note: You must have a date column in your board to get accurate results in the chart if you are dealing with dates.
Goals Widget
monday.com lets you add a goals widget to help you set and track goals.
You select the columns you want to monitor. Then, it’s simple to compare numbers and set specific goals to see how you’re progressing.
Other Widgets
You can make different charts and widgets based on what your business needs. For example, widgets for tracking:
- Hours worked
- Bounce rates
- Website traffic
Creating widgets lets you visualize important data in simple and meaningful ways. Check out the widgets in your dashboard so you can make the best KPI board for your company to see exactly what you need.
Knowing how to build a KPI dashboard in monday.com makes it simple to track vital metrics and make decisions based on data. Here is a sample of what a full KPI dashboard could look like.
Still need help? Consider a free 30-minute consultation with our team.
We’re ready to make your monday.com experience as smooth and easy as possible. Getting started is the hardest part. Once you’re up and running, you’ll wonder how you managed without it!