
Have you ever noticed little problems with a website or app you use? Like buttons that don’t work right or pictures that won’t load? The developers need to know about these bugs to fix them. But it can be hard to keep track of all the issues reported.
That’s where a tool like monday.com can help. You can build a template to collect all the bugs in one place. Then, the developers have an easy way to see what problems to work on.
In this blog post, I’ll explain the process of setting up a board to manage the bug reports of your website or app.
If you want to watch the whole process in a video tutorial, check it below:
Template Board Structure for Bug Reporting
Bugs should be something familiar if you’re someone who builds or manages websites or apps. This template board will help you keep track of all of those bugs and get them fixed in a timely manner.
I’ve labeled the board as “Bugs Queue Management.” It has two different groups for separating open bugs from resolved ones into different groups.
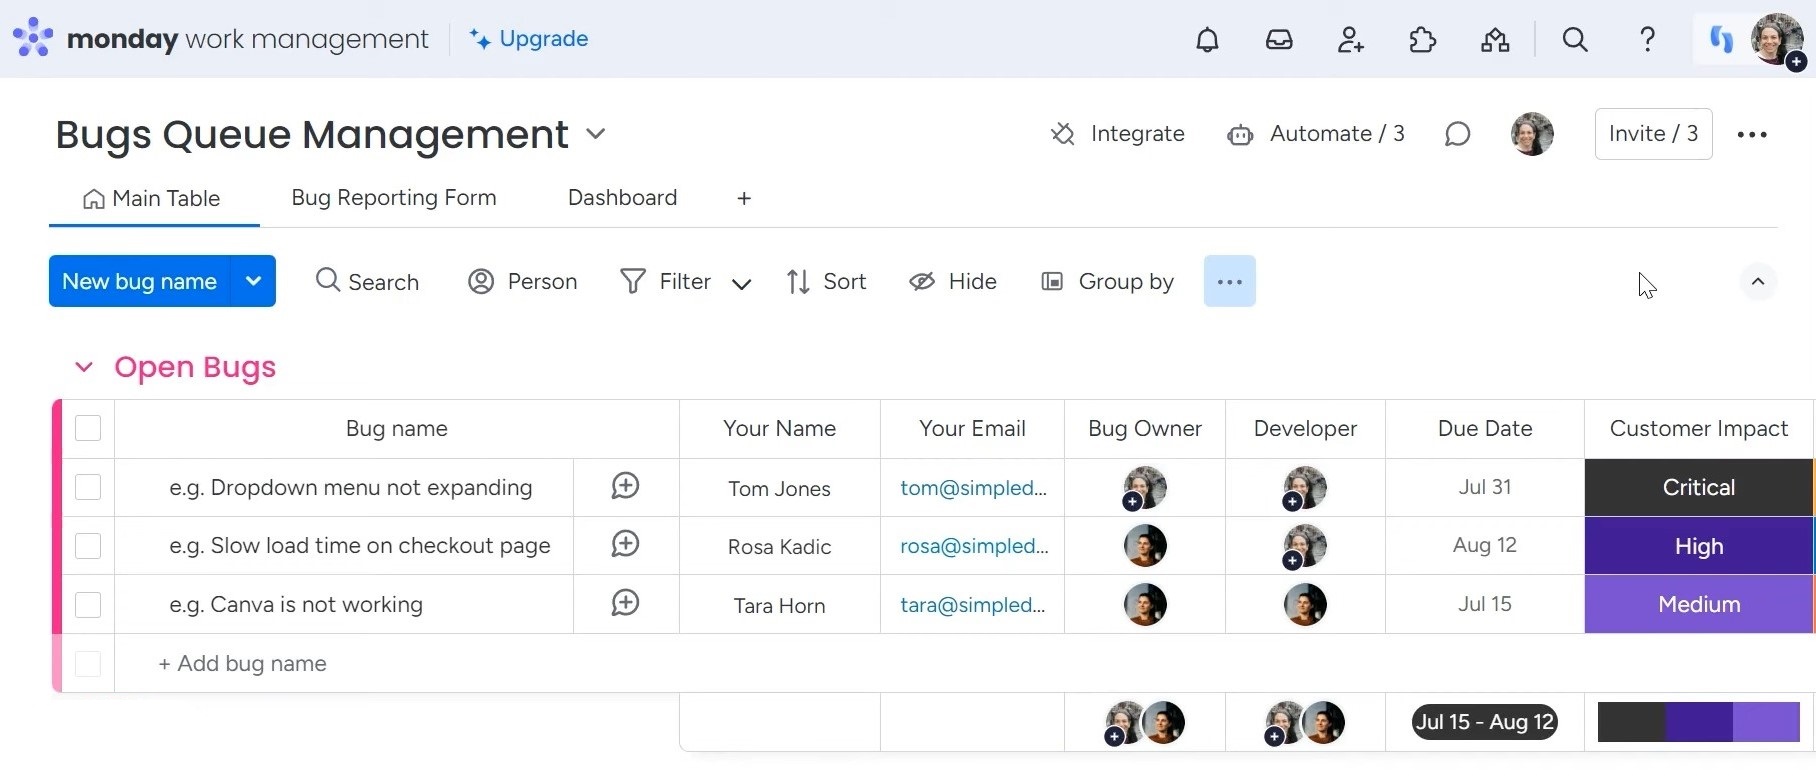
The Columns of the Bug Reporting Board
I’ll here discuss the columns in the “Open Bugs” group to give you a clear idea of the template.
For open bugs, each report includes fields for the bug name, the person reporting it, and their email. This helps identify who found the issue and how to follow up.
There is also a column for the internal team member assigned as the owner and developer in charge of fixing it. Sometimes these roles are filled by different people, so it’s good to track them separately.
Other useful columns include the due date, customer impact, and status. The due date keeps teams accountable for resolving issues timely. Prioritizing fixes based on customer impact ensures the most critical bugs affecting users are addressed first. The status column updates whether a report is new, in progress, or fixed.
One unique column is the source. Knowing where a bug originated, such as from compliance, quality assurance, or a user, helps determine what needs to be done to solve it. This provides valuable context compared to issues reported by other teams or individuals.
Creation logs automatically date every issue for clear visibility into origination timelines. Time tracking metrics are equally valuable, indicating how long it took to both analyze and resolve each defect.
To provide further context, reporters can upload supporting files like screenshots or videos directly on the board. Estimated fixing time predicts workloads, or the column can capture actual hours spent when used with a timer. Summarizing total time across all tracked stages gives comprehensive time cost perspectives too.
There is also a Preview URL column for your internal team to demonstrate the state after fixing the error. Finally, security severity rating ensures the highest priority is placed on stability and privacy threats.
Setting up the Board with a Form
You can create the board’s columns with a simple monday.com form. When a new issue is discovered, the finder fills in their name and email along with key details, including the title, priority level, source of the bug, a thorough description, etc.
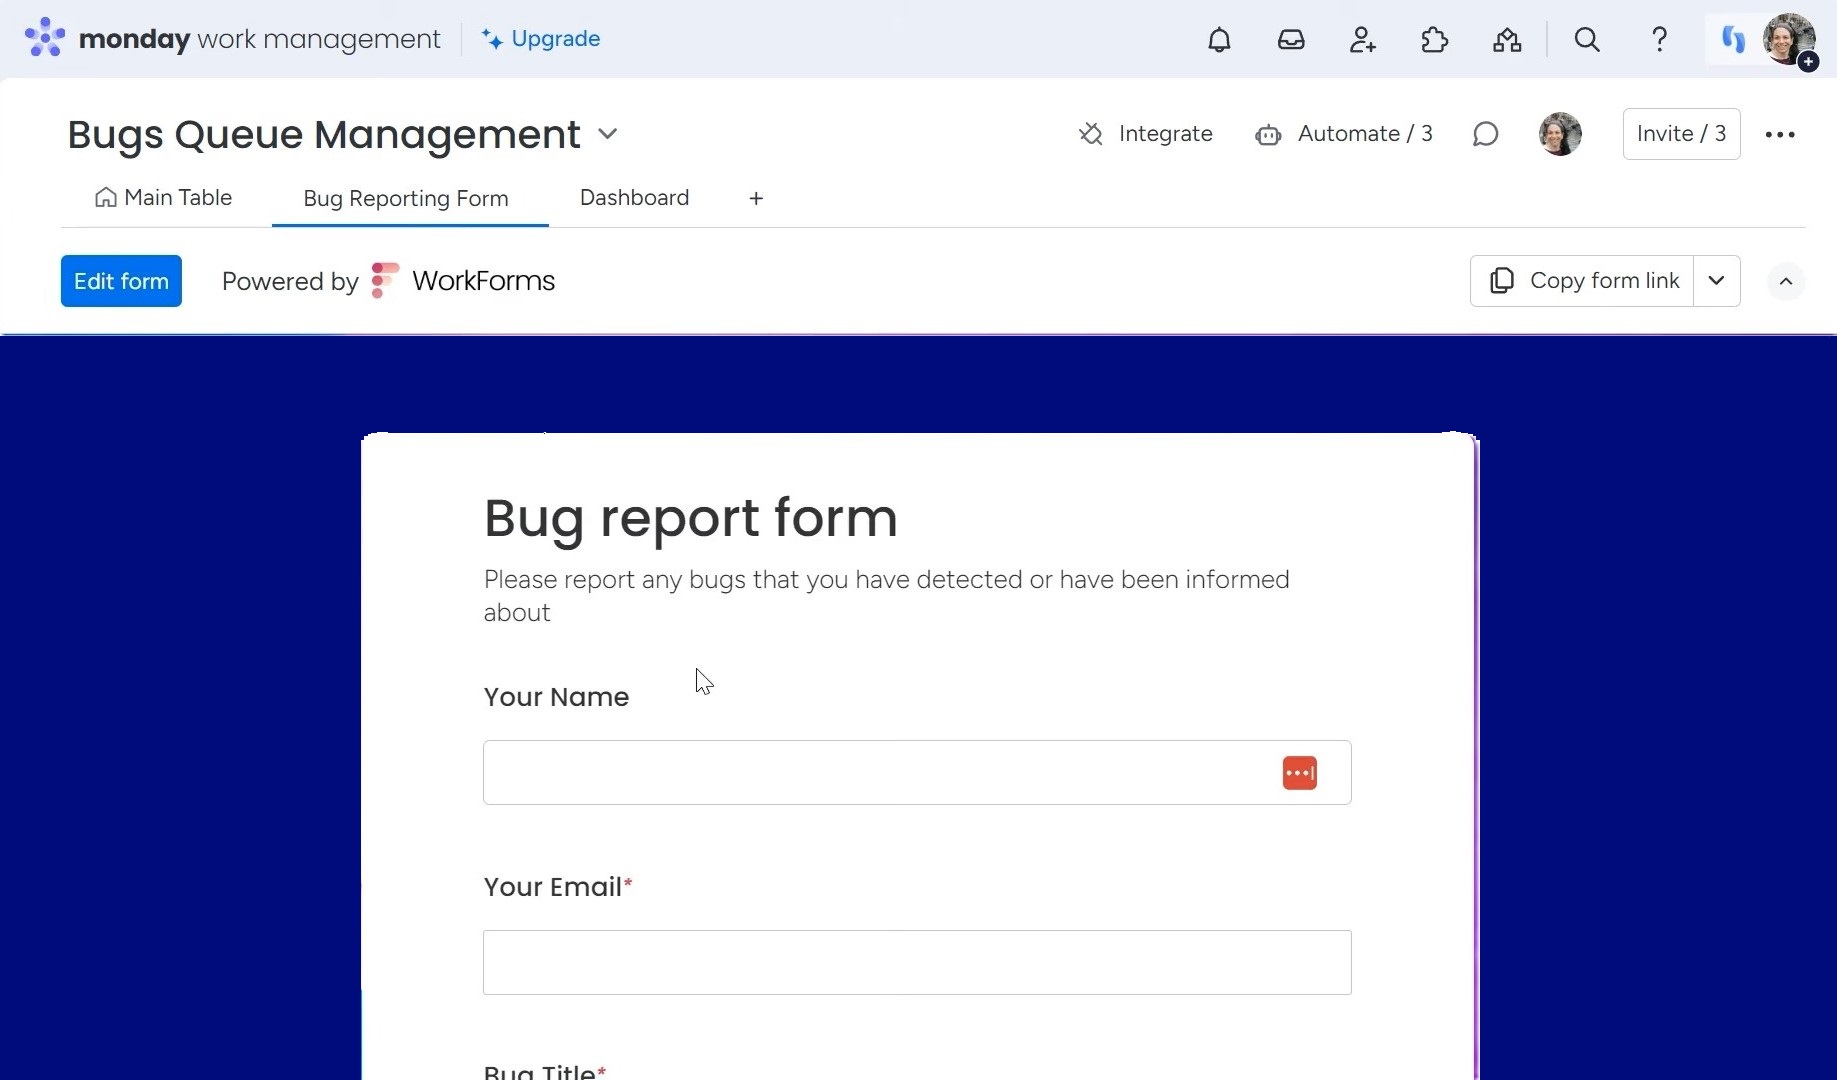
Optional components let the reporter attach files like screenshots or a short video to provide visual context. Once submitted, this form automatically generates a new card that populates in the “Open Bugs” section of the board.
Having all bug reports enter through the same standardized intake streamlines reporting and ensures everyone captures the necessary information upfront.
Automation Options for Time Tracking
Automating timers is a handy way to effortlessly track how long it takes to resolve bugs from start to finish.
An initial automation can kick off a timer as soon as a new report is submitted. Then, stopping and starting timers along the way captures the time spent actively working on each issue by different people.
Automatic time tracking provides visibility into individual and overall processing durations without requiring manual logging. All the timing data rolls up to a total time metric showing how long it took from when the bug was first received to being finally fixed.
Understanding the Dashboard Overview
The dashboard gives managers an at-a-glance view of key bug tracking metrics. They can instantly see the current status of all open reports, including how many are resolved, on hold, waiting on additional information, or actively being worked on.
Charts also show the total number of open versus closed bugs over time. By adding filters for specific dates, teams can evaluate their progress resolving issues on a weekly or monthly basis.
Additional widgets provide a deeper analysis. Average time per bug highlights workflow efficiencies when compared to estimates. Easy pie charts break down bugs by customer impact, security severity, and submission source. This helps stakeholders understand where to focus quality efforts by identifying the most common problems or their typical origins.
Whether intended for a product, engineering, or security role, the customizable dashboard shows the information you need. It creates shared visibility for driving ongoing collaborative improvement.
Have you liked this template for bug fixing? Then, you will love Simpleday’s OrganizerPro template collection! Our service has helped plenty of businesses to be more organized and efficient.