
In the dynamic world of project management and collaboration, having a clear and organized overview of tasks, data, and progress is paramount.
Enter the dashboards in monday.com, a robust tool that enables users to gather and visualize essential information from various boards, fostering better decision-making, efficiency, and teamwork.
In this guide, we’ll delve deep into the realm of dashboards, exploring their types, creation, customization, and the range of widgets they offer.
Understanding Dashboards: Types and Importance
Dashboards allow you to visualize and track key data from your boards in one place. They allow monitoring important metrics and get valuable insights into your business.
There are two main types of dashboards you can create in monday.com:
1. Individual Dashboards
These are dashboards added directly to a specific board. They only pull and display data from that particular board.
Individual board dashboards are designed to consolidate data from a specific board, providing a focused view of metrics and statistics related to that board’s content.
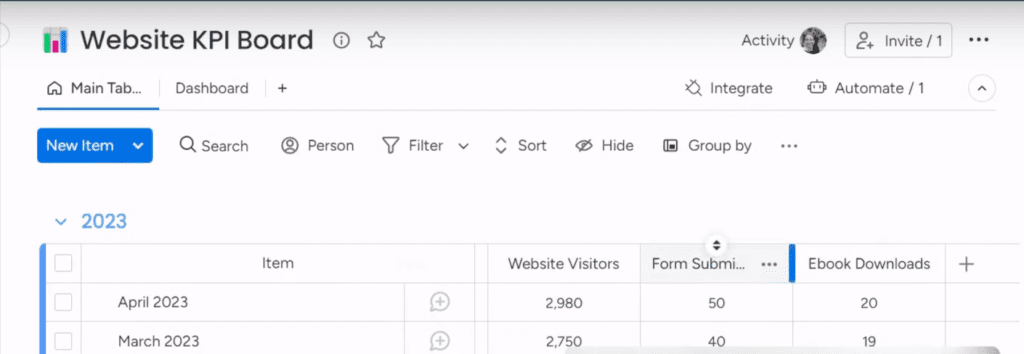
To create an individual board dashboard, navigate to the relevant board, click the “+” button in the view, and select “Dashboard” or “Blank View” (in newer versions).
This dashboard will exclusively display data from the chosen board. For example, you can set up a dashboard for tracking website KPIs, displaying metrics like visitor count and forum subscriptions.
2. Cross-Board Dashboards
On the other hand, cross-board dashboards act as centralized hubs, collating information from multiple boards, and allowing for a holistic perspective on various projects and metrics.
To create a standalone dashboard, click “Add” and then “New Dashboard” in the left sidebar. Assign a suitable name, choose whether it’s meant to be shared or private, and create the dashboard.
You’ll then be prompted to select which boards you want to connect it to. The Pro Plan allows connecting to 20 dashboards and the number increases to 60 in the Enterprise plan.
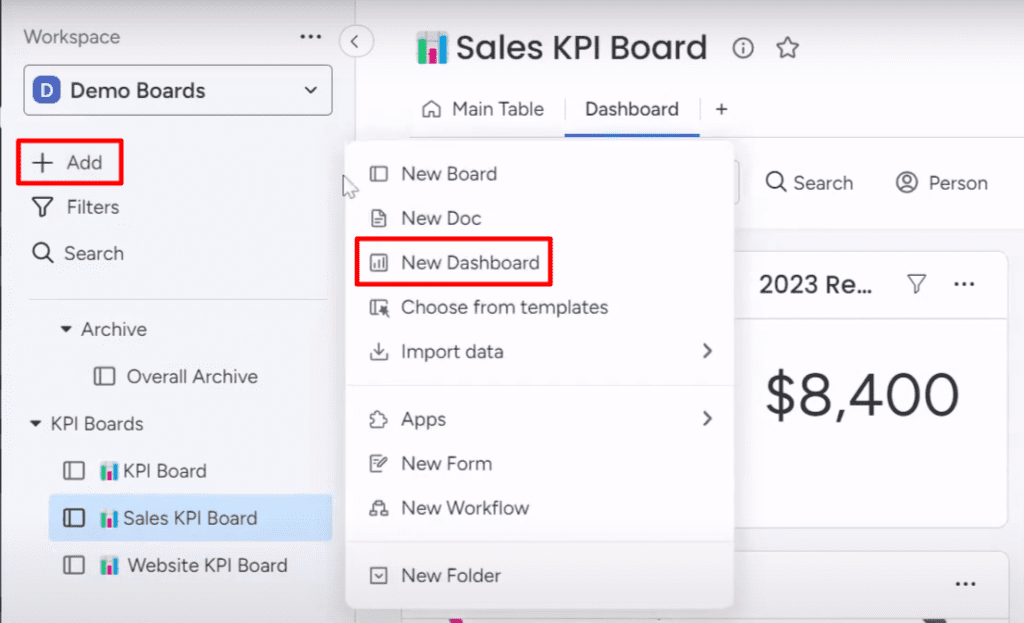
These dashboards give you a birds-eye view of information across the connected boards. They’re great for tracking company-wide KPIs.
Cross-Board Dashboards: An In-depth Look
For a more comprehensive overview that spans multiple boards, cross-board dashboards come to the rescue. You can customize these boards by adding various available widgets.
Adding and Customizing Dashboard Widgets
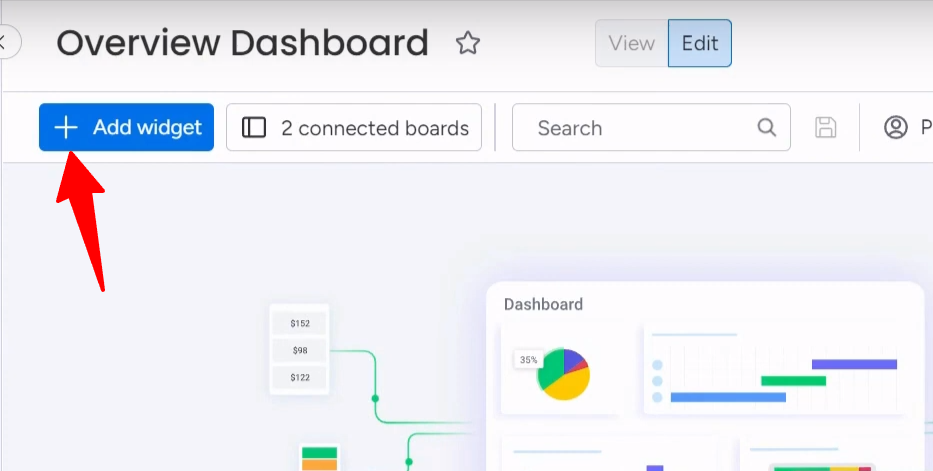
The real power of dashboards lies in their widgets, which allow you to visualize data in diverse ways. There are widgets like numbers, charts, tables, and more to display data. To add a widget, click “Add Widget” on the dashboard.
You can customize each widget by clicking the 3 dots icon and going to Settings. Here you can:
- Select which data to display
- Change the widget type and format
- Apply filters to only show certain information
- Set start and end dates
Some useful widgets include:
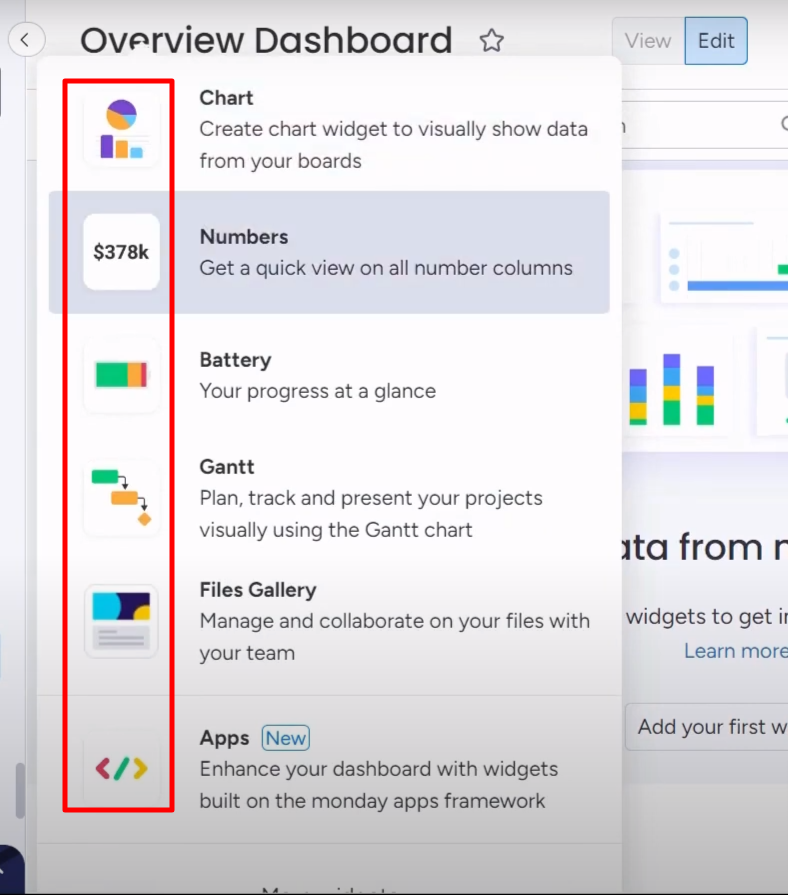
Numbers Widget: This widget displays numerical data and allows you to customize calculations. It’s perfect for summarizing figures like orders or visitors. You can choose to sum, average, or apply other calculations to the data.
Chart Widget: The chart widget is versatile, offering options such as pie charts, bar graphs, and more. By selecting the data you want to track, you can represent trends and patterns visually. Filters can be applied to refine the data being presented.
Goals Widget: The widget aids in setting targets and tracking progress towards them. Whether it’s hitting a specific number of website visitors or achieving sales targets, it lets you monitor your goals effortlessly.
Time Tracking, Calendar, and Workload Widgets: These widgets facilitate project planning and resource allocation. From tracking time spent on tasks to managing team workloads, they enhance project efficiency.
Advanced Features: Filters and Data Integration
Dashboards also offer advanced features like filters. These filters can be applied at the dashboard level, or even for specific widgets, allowing you to customize what data is displayed. Whether you’re filtering by year, person, or other criteria, these tools enhance data relevance.
The Power of monday.com Dashboards
With the dashboard option, you can:
- Gain valuable insights by visualizing key data
- Track KPIs to monitor performance
- Combine information from multiple boards into one place
- Identify trends, issues and opportunities at a glance
Dashboards take your reporting to the next level. They let you spot patterns, track progress, and make data-driven decisions to enhance your business.
Want to take your dashboards to the next level? Contact us for chatting up with our monday.com experts. We’ll assess your current setup, identify opportunities for improvement, and provide customized recommendations to help you get the most out of the platform.