Keeping reports of your coaching business’s KPIs and metrics manually on paper or excel is pretty stressful. It also takes a lot of time to write everything and update the changes. I’ve been there and am familiar with the struggle.
But the time for doing these manual tasks is over. I’ll show you how to create reports to track KPI’s and metrics for your coaching business using monday.com and automate the process. So, let’s get into the procedure.
The Process of Creating Reports to Track KPI’s and Metrics
If you run a coaching business, you need to keep records of the business’s KPIs and metrics. The data shows how your business is doing and helps you to make informed decisions.
Writing these reports on paper or even in excel is a big task and requires lots of your time. But monday.com can streamline the entire tracking process.
Here’s how to create reports to track the KPIs and metrics of your business:
Set up your board
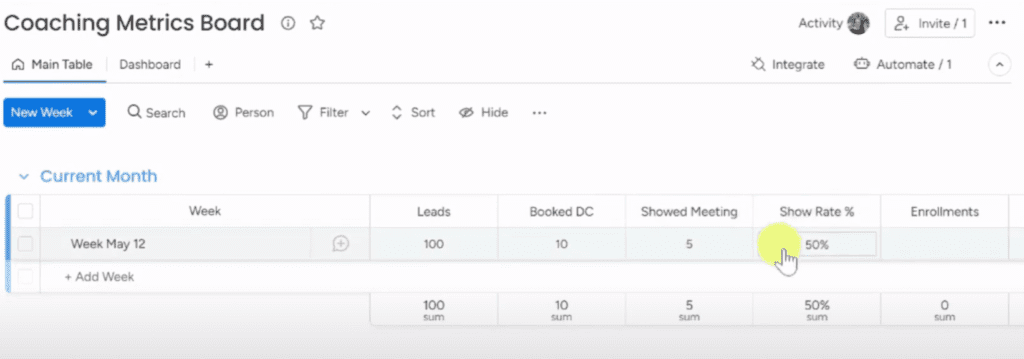
The first step is to create a monday.com board. This board should include columns for the current month and past months, and you can choose to enter the information on a weekly, monthly, or daily basis, depending on your preference.
I’ve chosen to do it on a weekly basis for this example.

The first metric to track is the number of leads. This is followed by the number of discovery calls booked and the number of people who actually showed up to the meeting.
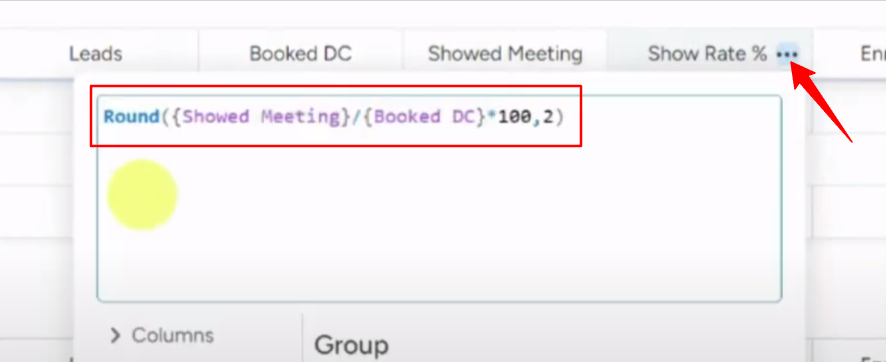
The next column is a formula column that calculates the show rate, which is the number of people who showed up to the meeting divided by the number of booked discovery calls.

Once you have the call with the client, the next columns track the number of people who actually enrolled in your coaching program and the percentage of leads to sales or enrollment, and the percentage of meetings to sales.
The next set of columns track your revenue, including how much you collected, the number of cancellations, and refunds.
Once you have your main table set up, you can create a dashboard that displays all the important metrics and KPIs in one place.
Dashboard Set up
You should create a minimum of three widgets on the dashboard to cover all the reports. Here are the widgets and their functions:
1# Number Widget
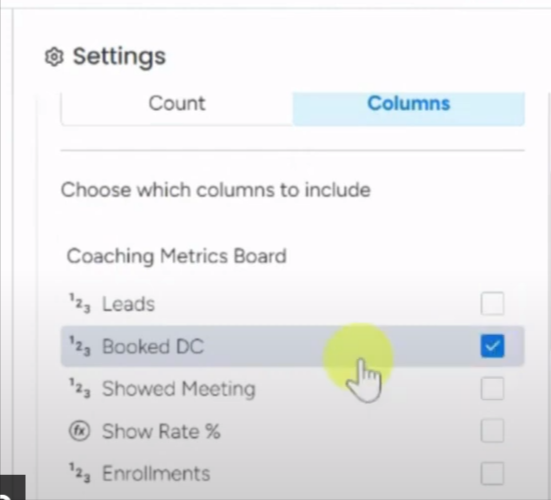
Click the “Add widget” button and select “Numbers” from the options. From the setting of the new number widget choose the data you want to display.
The numbers widget displays the number of items on the board, such as leads, booked discovery calls, or cancellations.

You can also choose specific groups created under the Coaching metrics board. Say for example, you can select the “current month” or “past months” and the widget will show the selected data for that specific period.
2# Chart Widget
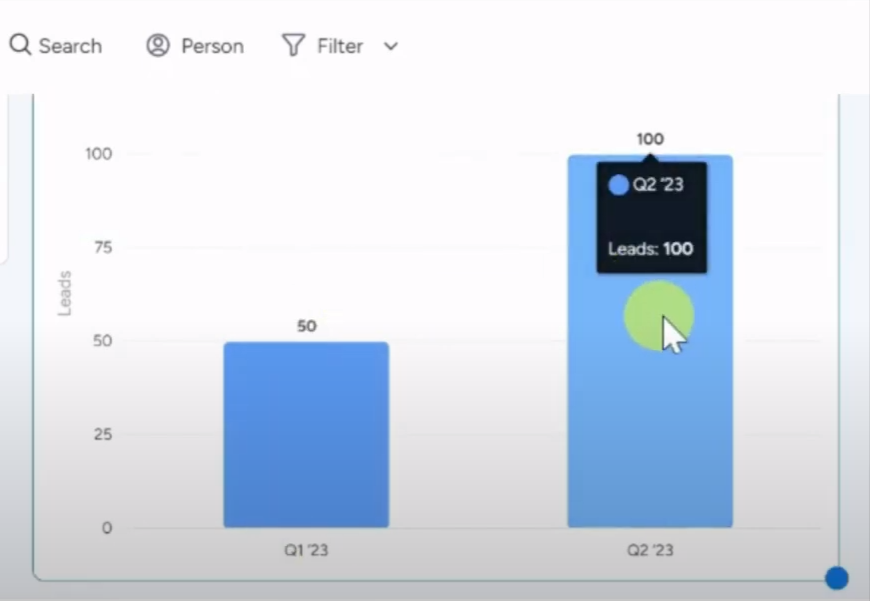
Adding a chart widget is very simple. Just click on add widget, and choose the charts option (the same way you choose the numbers option). Once added, go to the chart settings to customize it. Here you can select the chart type and how to segment the data by date, month, or quarter.
Scroll down to the “Y-axis” section and pick what you want the chart to count. Options could be leads, meeting participants, enrollments, and so on.
According to your selected options, the chart widget displays a chart that shows your progress over time, such as the number of leads by quarter.

3# Leads Widget
Click “Add Widget” from the “All Widget” option and then search for “Goals.” Add the “Goals – Beta” widget to your dashboard. Then, go into the widget settings to personalize it.
Name your goal, something like “Generate 600 leads per month.” Set your target number of leads at 600. Choose the data column you want to track from your dashboard. Since you’re tracking leads, select the “Leads” column.
That’s it! Now you can see the number of leads you’ve gained against the target you set.

I’ve found monday.com helpful in organizing my KPI’s and metrics – give it a try. You’ll be surprised how quickly you can get insights into your business’ performance.


